Website statistics
Statistics allows you to view information about the visitors to your website. Statistics compiles figures for the previous day’s activity every night.
Webite statistics are added to a Homepage using the Website statistics widget.
This feature can be used on Galaxies sites only when the sites are having registered domain.
Navigating to the Statistics area
- Click the Utilities icon in the left navigation bar. The Utilities menu will open.
- Click the Statistics link in the second group of links. The Statistics overview area will now be shown.
The overview shows information for the last 7 days including:
- Number of page views each day.
- Top 10 referrers.
- Top 10 pages.
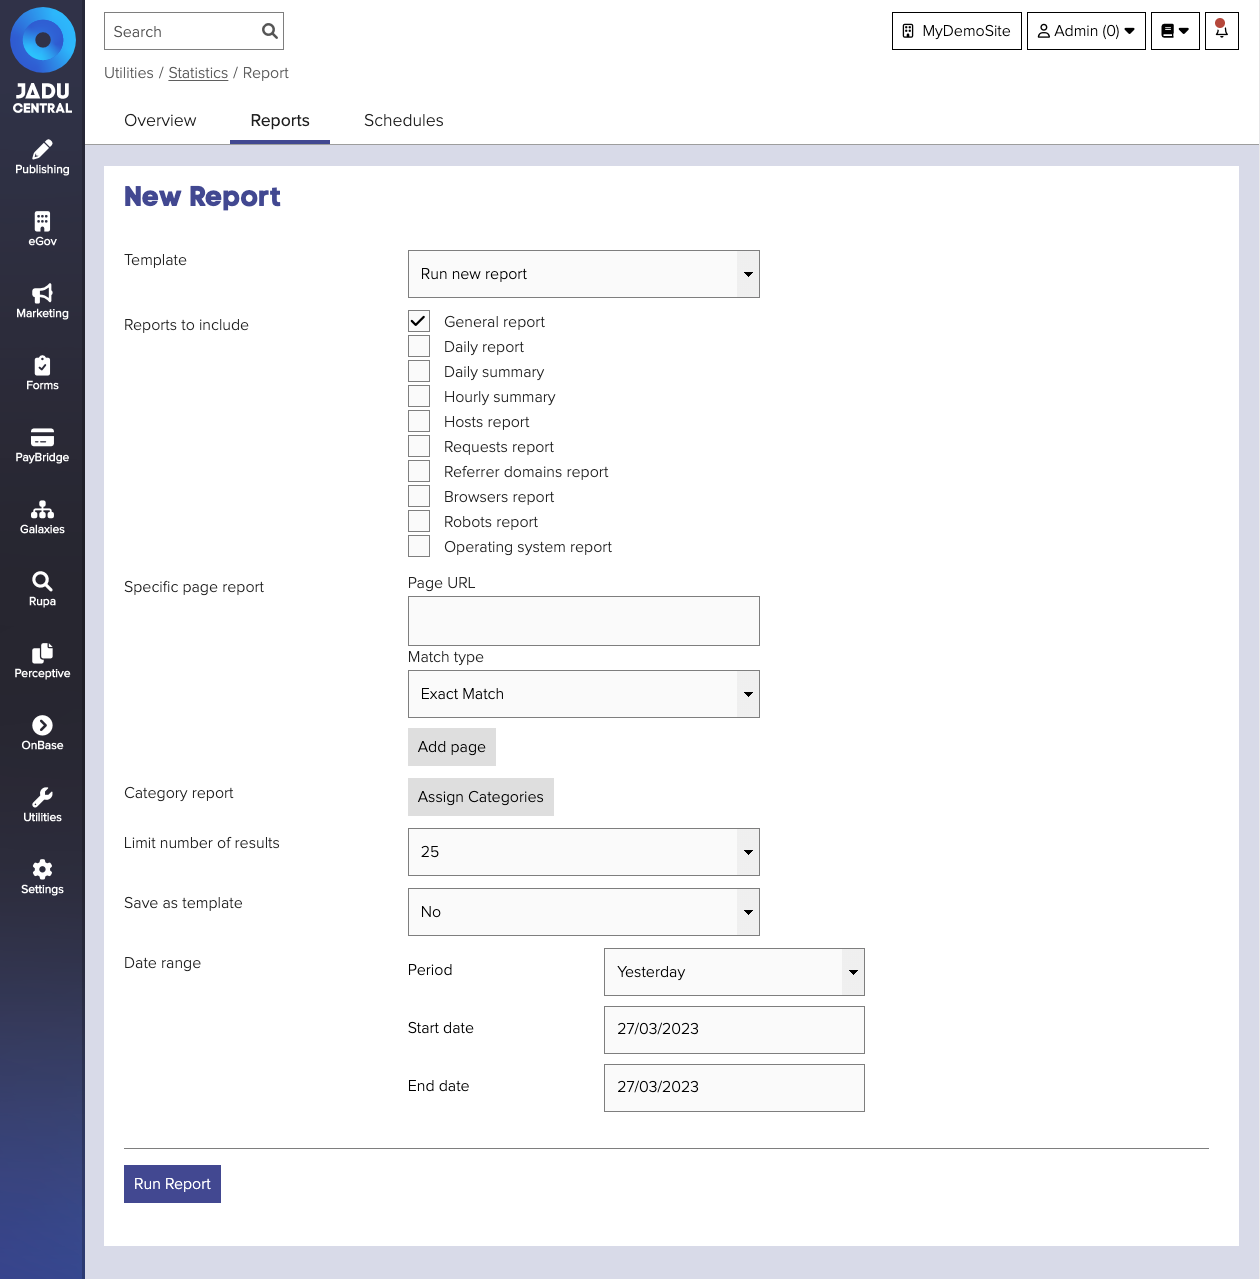
Report fields
| Field | Notes | Required? |
|---|---|---|
| Template | Select a previously saved report template to run. | |
| Reports to include | Use the check boxes to select which reports you would like to view. | |
| Specific page report | In addition to the above reports, it is possible enter a number of web page addresses from your website to see how many people have visited the relevant page(s). | |
| Category report | Categories can be selected to show how many requests each item in the category (e.g. documents, downloads) has had. | |
| Limit number of results | The number of results you would like to show for each report. The more results you would like to see, the longer the report will take to generate. | |
| Save as template | Save the selected reports as a template that can be re-used. | |
| Date range | Dates (inclusive) for the period for which you would like to see the selected reports. |
Report types
| Report | Notes |
|---|---|
| General Report | The general report provides a brief overview for the period you choose for the report. This includes successful requests, redirected requests, failed requests, distinct hosts served and data transferred |
| Daily Report | The total number of pages requested for each day covered in the selected report period. This figure only includes page requests for the period of the report. |
| Daily Summary | This report shows how many pages were requested on each day of the week for the report period. |
| Hourly Summary | The hourly report shows how many page requests were made during each hour of the day. |
| Hosts Report | The hosts report shows who has made page requests. Initially, this shows the IP address of the computer used to access the website. |
| Requests Report | This report shows which pages have been requested, how many times and how many unique people have requested the page. |
| Referrer Domains Report | The referrer domains report shows the websites with links to your site that were used the most to access your site. |
| Browsers Report | The browsers report displays which web browsers have been used to access your website. |
| Robots Report | The robots report displays robots that have accessed your website. A robot is a program that automatically crawls your website from time to time. For example, Google compiles its results by using a robot to crawl many of the sites on the internet. |
| Operating System Report | This report shows which operating systems people are using when accessing your website, for example Windows, Mac OS X and Linux. |
Exporting reports
While viewing a report you can export the results you are seeing to a PDF or comma separated value (CSV) file.
To do this, try the following:
- Run the report from the Statistics area.
- Click the Actions button, and select Export results from the options. The Export results panel will open.
- Select the type of export you'd prefer from the Export type dropdown.
- Click the Export results button. The file will be downloaded to your computer.
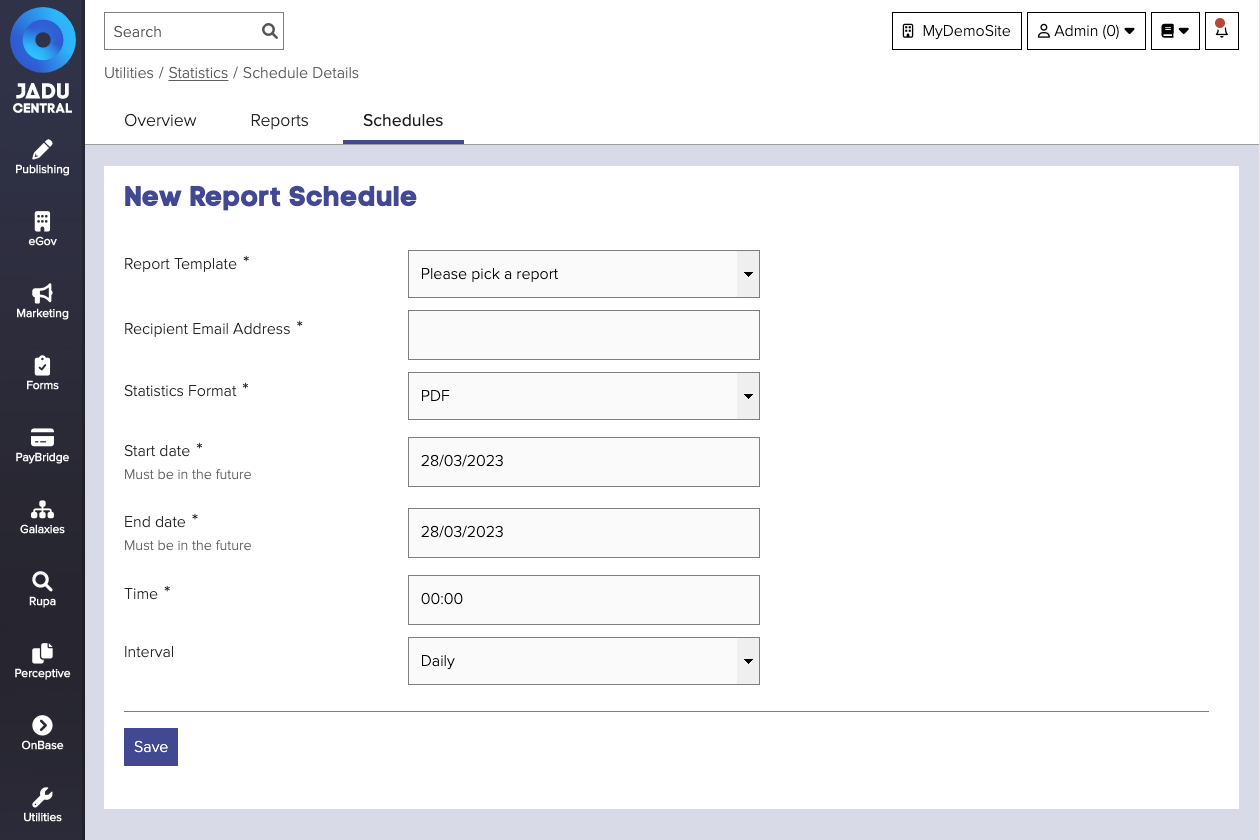
Schedule fields
| Field | Notes | Required? |
|---|---|---|
| Report Template | Select a previously saved report template to run. | ✅ |
| Recipient Email Address | The email address(es) for where the report will be sent. Multiple email addresses can be comma separated. | ✅ |
| Statistics Format | The format you would like to receive the report in, either PDF or CSV. | ✅ |
| Start date | The date range in which you would like the report to be sent. | ✅ |
| End date | The date range in which you would like the report to be sent. | ✅ |
| Time | The time that you would like the report to be sent. | ✅ |
| Interval | How often you would like to receive the report. |
Scheduling reports
You can schedule reports to be emailed to you at a particular time and regular intervals.
Before you schedule a report to be run, you must have first saved a report template.
To schedule a report, try the following:
- Navigate to the Statistics area, and click the Schedules tab. The list of existing scheduled reports will be shown.
- Click the New schedule button. The new schedule form will be shown.
- Complete the schedule details and click Save to save your changes.
Comparison with Google Analytics
When you compare data between client side analytics tools, eg. Google Analytics, and server side statistics eg. built in Website Statistics, the numbers will always be different.
The main reason for data differences relate to how visits to the website are tracked.
Client side tracking may be blocked if JavaScript is disabled, or the tracking request is blocked by the browser, visitor's firewall or a proxy filter.
Where as, server side tracking will show everything requested from your site - including visitors that block client side tracking, and requests coming from non-visitors like search engine crawlers.